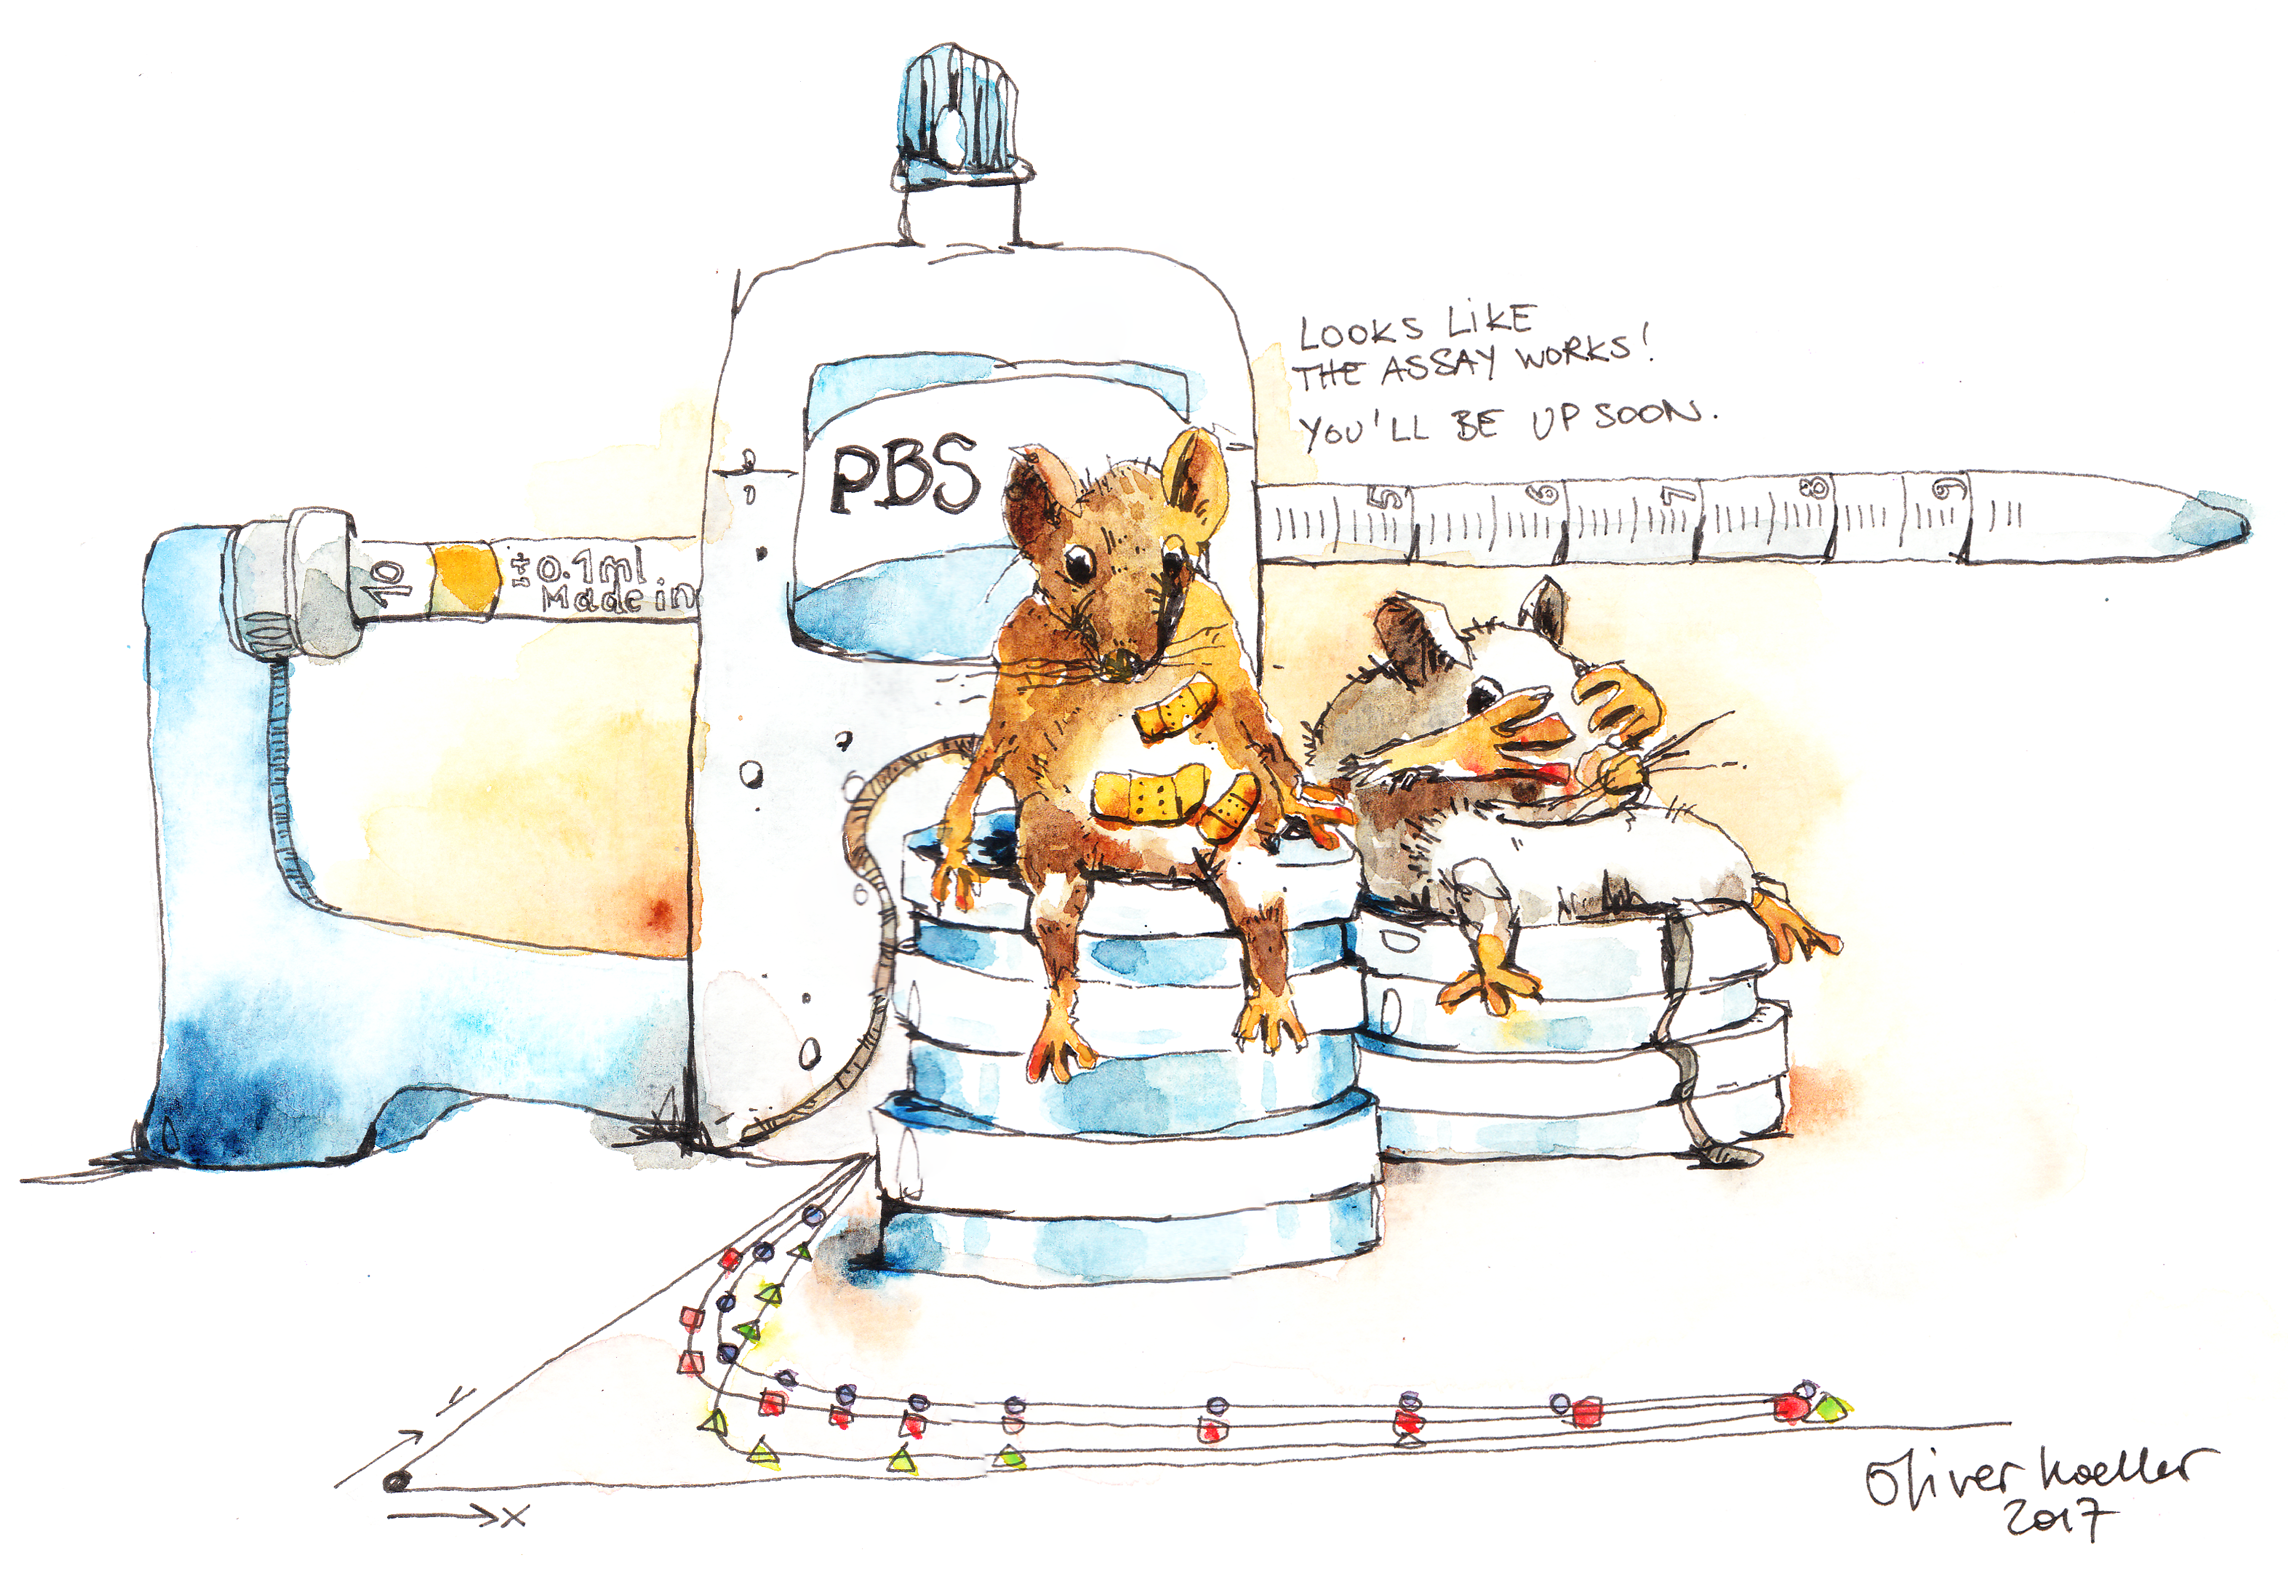

With the reproducibility crisis in science showing no signs of abating, it’s never been more important to clearly communicate how rigorously your data were obtained. Here’s TIR’s short guide to technical replicates, biological replicates, independent experiments, and what they do and don’t tell you.
When you’re doing experiments and, later on, preparing to publish them, it’s essential that you are clear – both to yourself and your readers – on how reproducible those conclusions are. However, there are many sources of variation in data, and demonstrating reproducibility requires time and care.
1. Technical replicates Technical replicates are when you set up multiple identical experiments and run them in parallel, or take multiple readings from a single experiment. Good examples are enzyme assays or growth curves. At a chosen timepoint, you take measurements from each of those replicates, and calculate the mean value. The more technical replicates you have, the more accurate your estimation of the mean value will become. In other words, technical replicates control for the experimental variability for a given biological sample on a given day. However, no matter how many technical replicates you have – whether it’s 5 or 500 – your overall sample size is still 1 (n=1). All those measurements are averaged into a single mean value, and that’s your result from that one experiment. The number of technical replicates you use will usually be determined by how well-behaved the setup is and by simple convenience; calculating cumulative mean* values across technical replicates and seeing how quickly they converge on a mean is a good way of getting a sense of how much variation there is in your data.
2. Biological replicates Of course, what technical replicates can’t control for is how representative your sample is. There will always be biological variation between different samples, whether they’re mice, cell lines, or preparations of purified protein, and it’s likely that this will be the greatest source of variation in your data. You can do as many technical replicates as you like, but if your sample is abnormal then your mean value is not going to be representative of the population as a whole. Biological replicates address this. By taking measurements from different biological samples (different mice, different cell lines, different protein preparations), you get a sense of how reproducible your data are against the background of intrinsic biological variation.
3. Independent experiments However, what biological replicates don’t necessarily control for is human error. You can set up multiple technical replicates for multiple biological samples, but if you forget to add the enzyme/drug, or mix up your tubes, or do any of the hundreds upon hundreds of things that can spoil an experiment without your realising, then your data won’t be right. No amount of technical or biological replicates can protect you from human error on the day. Human error is an unavoidable feature of lab work, and the best way to control for it is to do independent experiments. Only by carrying out multiple independent experiments on different days can you be confident that an effect, or lack of it, is likely to be genuine.
Blurring the lines Ideally, you should aim to quantify multiple technical replicates per experiment (exact number estimated through calculation of cumulative means), from multiple biological replicates, and on different days (independent experiments) in order to be 100% sure of your data. However, there’s a trade-off between rigour and rate of progress. Obviously you want your data to be as ironclad as possible, but at the same time it’s worth asking how much time to invest in obtaining what might be a trivial conclusion.
In some circumstances, blurring the lines between biological replicates and independent experiments is an acceptable shortcut – i.e. assaying your biological replicates on separate days in order to kill two birds with one stone. Whether you take this shortcut or not (and remember, it is a shortcut), it’s still good practice to define what you mean by “technical replicate”, “biological replicate” and “independent experiment” in your Materials & Methods sectionso that your readers are absolutely clear on what you did.
In cell biology In whole organism (e.g. mouse) work, the difference between technical replicates and biological replicates is pretty obvious – technical replicates are readings derived from a single mouse, biological replicates are readings derived from different mice. In cell biology it can be a bit harder to define things. For instance, if you’re doing an immunofluorescence experiment, what constitutes a technical replicate? Preparing identical coverslips in parallel, or are the hundreds/thousands of cells on a single coverslip all technical replicates, given that they’ve been exposed to the same labelling conditions but may respond slightly differently? If you’re dealing with a transgenic cell line, then biological replicates are different clones – but those clones could have been obtained from only one or several separate transfections (that tradeoff between rigour and speed again).
As per the preceding section, the best thing is to state explicitly in your Materials & Methods section (in the statistics part) what definitions you are using. And don’t forget to provide detail on biological replicates and independent experiments in your figure legends!
Counting the ways How many independent experiments should you do? As many as possible really, but three is an achievable minimum for cell biology work. The number will generally be determined along empirical lines, with certain assays/techniques being more amenable to higher sample sizes than others.
As always, corrections and clarifications from readers are very welcome…
* Cumulative mean: calculating the cumulative mean is very simple. You take your first measurement, A. Then you take your second measurement, B. The mean value for your experiment is now (A+B)/2. With your third measurement (C) the mean value becomes (A+B+C)/3. And so on. These iterative calculations of the mean are the cumulative mean.
By plotting the cumulative mean values (A, (A+B)/2, (A+B+C)/3 etc) versus total number of observations (1, 2, 3) on a graph, you will see how your mean value for the experiment gradually converges towards a particular value. This value is your mean from the experiment.
A good rule of thumb is that your sample size for the experiment in question – i.e. the number of technical replicates – should be double the total number of observations required for the mean value to converge on a set point. Under circumstances of high experimental reproducibility, that means that your total number of technical replicates will be relatively low; however if there’s more variation in your setup then the mean will take longer to converge and you should be prepared to take a higher number of measurements. If no convergence is readily seen, this suggests that the level of variability is very high – possibly indicative of low-quality data.
Originally posted on Total Internal Reflection (HERE)


Join the FEBS Network today
Joining the FEBS Network’s molecular life sciences community enables you to access special content on the site, present your profile, 'follow' contributors, 'comment' on and 'like' content, post your own content, and set up a tailored email digest for updates.
Great post! I have already recommended it to my students.
Fantastic! Delighted that you think it's of use. Lots more to come... ;-)
We need a doi for this article so we can build a reference to it. Or, please Brooke, publish this as a note/letter in a Journal
Thanks. It is a good idea...
Thanks for your comment. Posts on the FEBS Network can be cited by their url (or you could consider using a short url). However, in the case of this one, the original post on TIR (here) should be cited.