
What’s the real purpose of scientific figures?
There’s a common misconception that they’re to show what we did. A picture may be worth a thousand words (and in certain journals with restrictive wordcounts, that’s a saving of real value – I name no names!) but if they’re purely for reportage of experimental data then that’s actually no different from the breathless and overly personal accounts of research one associates with the 19th century. You know the sort – “Imagine my astonishment the next morning when I crept down the stairs to find that both embryos were happily dividing!” If figures are only to show what we did then they’re no more than a pictorial representation of the writers’ opinions, and there’d be no need to display anything except schematics, really.
Rather, figures – visual representations of experimental data – are actually there to allow the reader to independently evaluate the veracity of the authors’ observations and interpretations. The authors share their data with the reader and are effectively saying, “Here! This is what we saw, and this is what we’ve concluded from the experiments. Would you concur?“
And in fact, this is one of the beauties of science – the equality of criticism. The view of the reader, any reader, is deemed equally valid if the point they raise is a pertinent one. The peer review process is there to guard against sloppy work and errors of fact, but the real court of opinion starts its proceedings once the article is published.
This is also the reason why “publication quality” is such an important – though highly subjective – descriptor of data. Good quality, publication quality, data are experimental results that are sufficiently unambiguous that only one or at most a limited number of interpretations are possible. Low quality data, low quality facts, are of a type that many interpretations are possible in addition to that put forward by the authors.
As such, figures – and by extension the entire scientific manuscript – are in fact an exercise in rhetoric. They are not there to show what facts the authors have discovered, they are there to persuade the reader(s) that the authors’ conclusions are robust. Good figures will (gently) compel you to agree with the authors, or at least concur that their interpretation is a plausible (though perhaps not the exclusive) one. Bad figures are ones that try to con the reader into agreeing with the authors by concealing their shortcomings*.
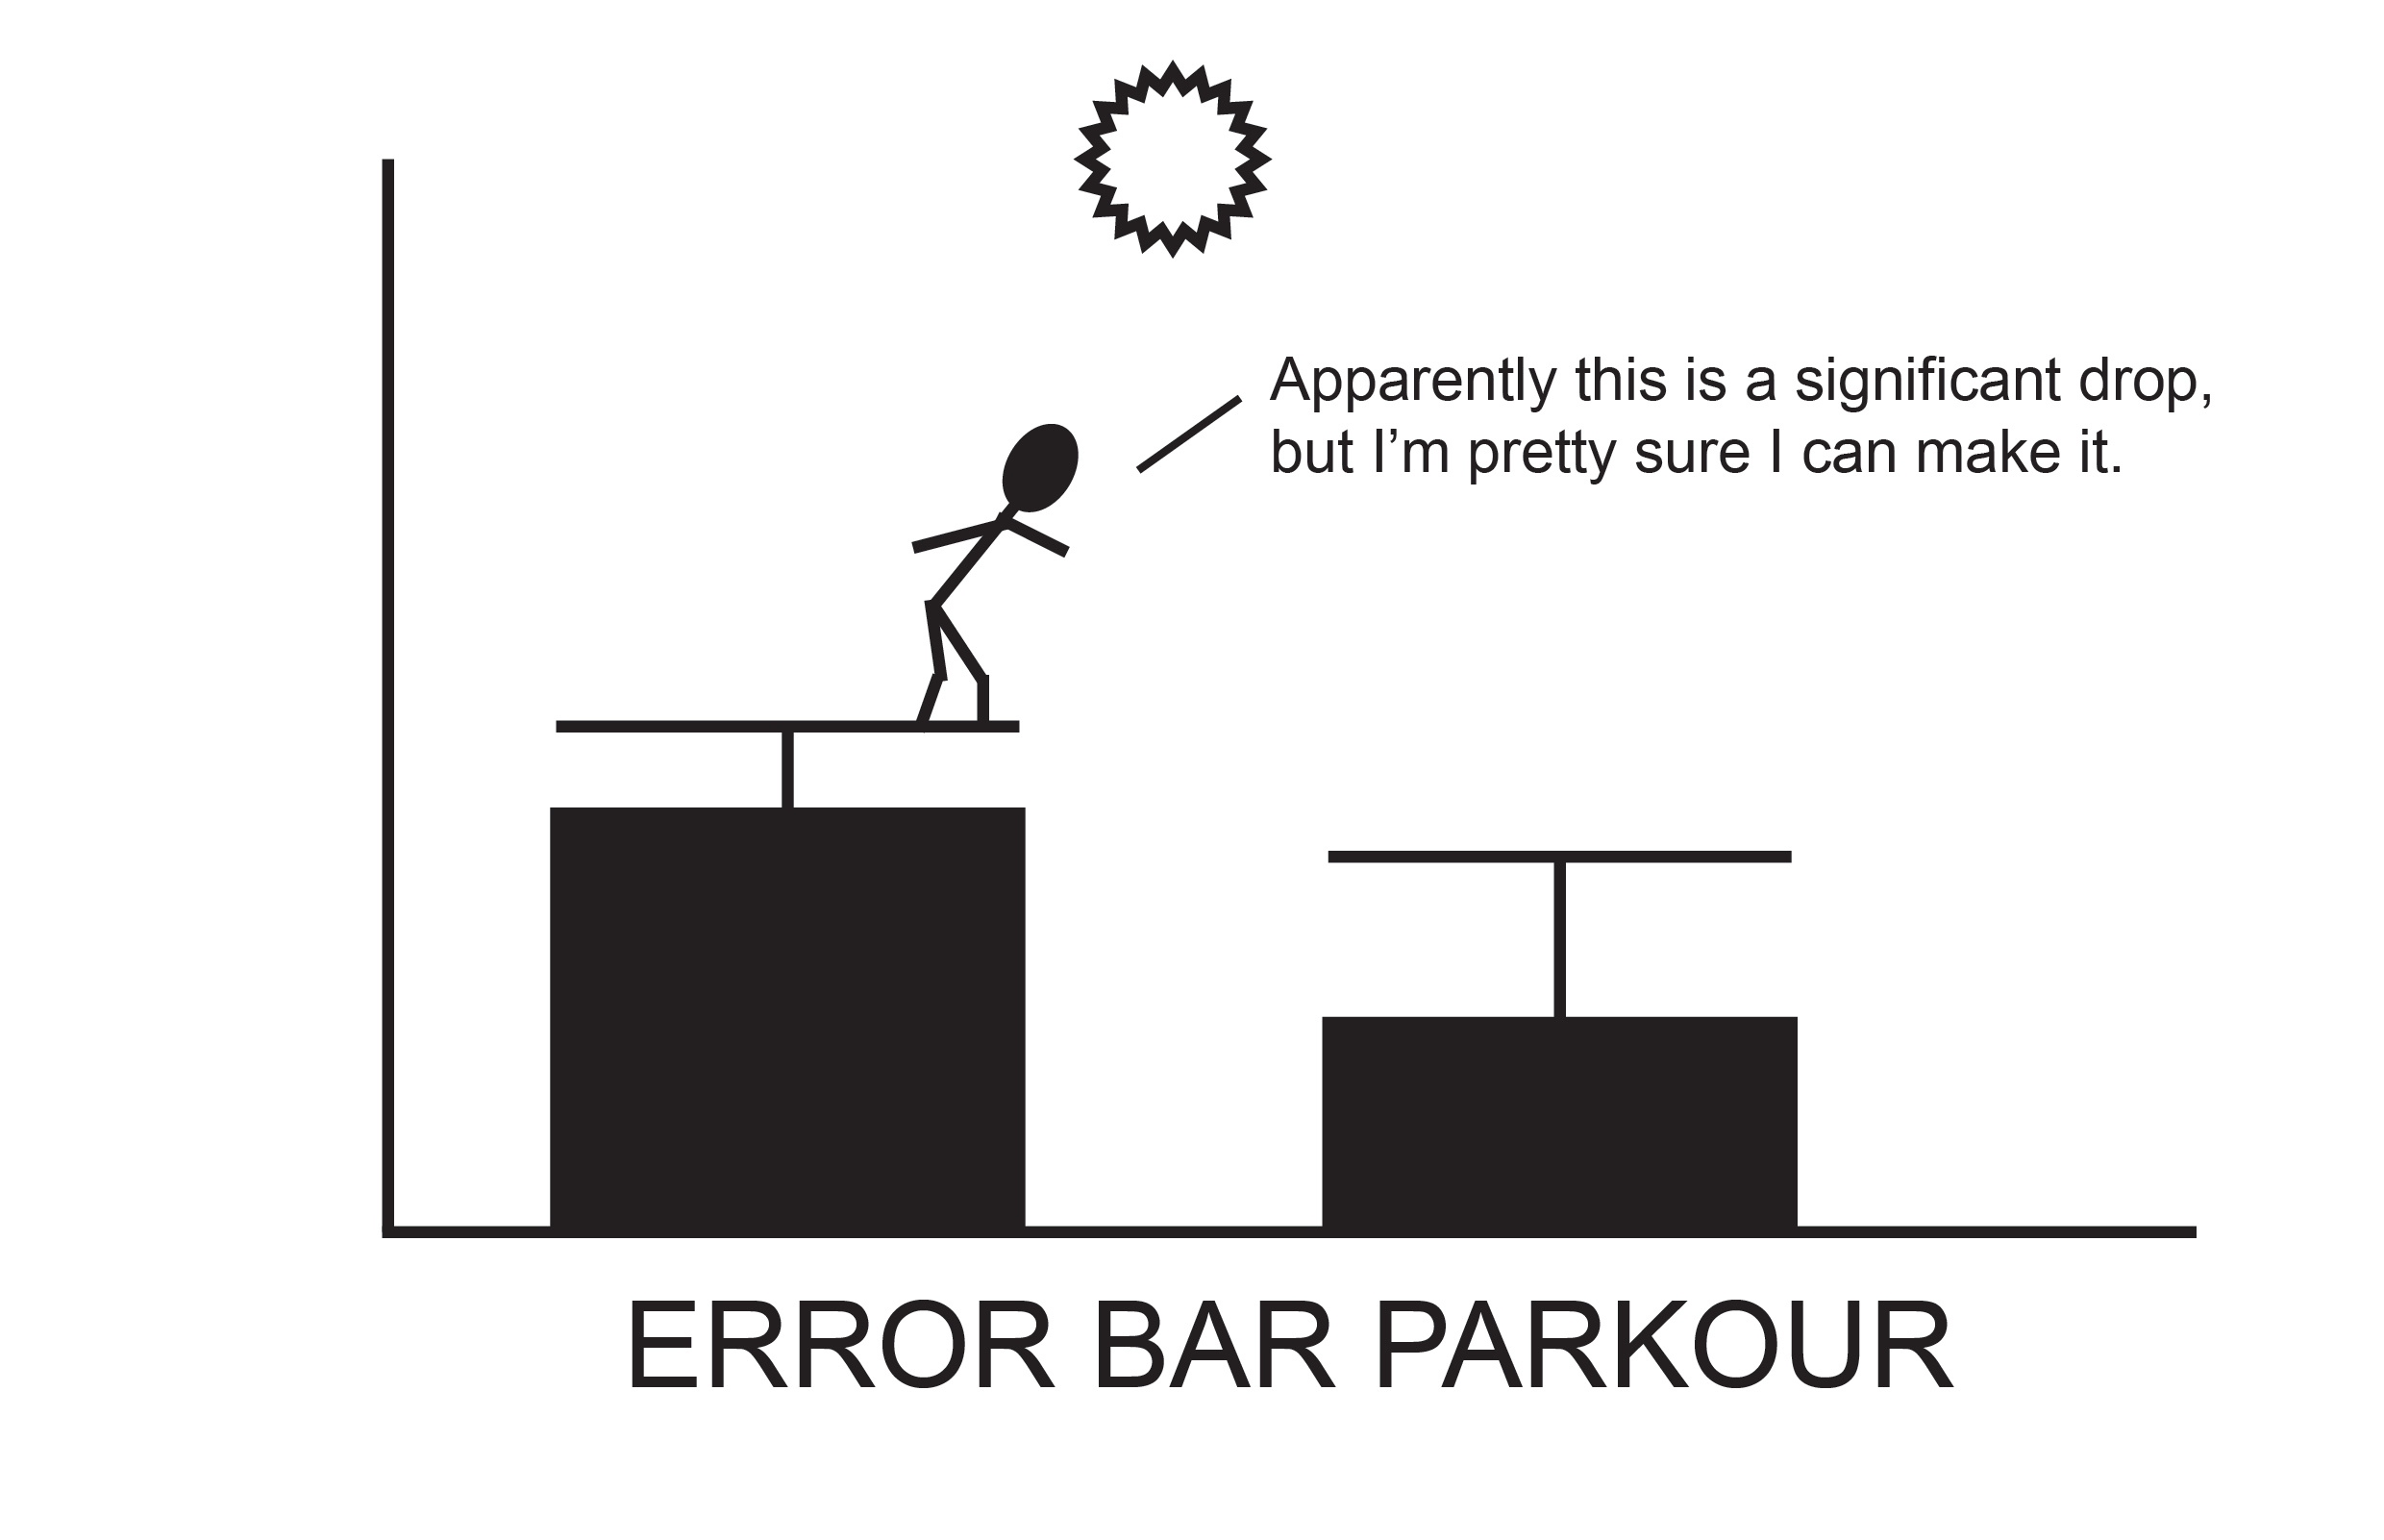
No tool is more widely employed in bad figures than statistics. Statistics have truly become the scientific sophist’s weapon of choice, and we would all do well to remember Rutherford’s maxim that “If your experiment requires statistics, you ought to have done a better experiment“. In the same way that a voiceover in movies is usually a giveaway that the makers are not confident in the clarity of their narrative, statistics are all too often an indicator that the authors do not have a strong phenotype. P-values are a fig leaf that’s hung on embarrassing charts as if to say, “The effect doesn’t look like much, but the p-value is good, so it must be significant!“
A big tip of the hat at this point goes to David Vaux, who has waged a dogged and patient campaign to get biologists in particular to see the errors in their error bars (1,2). The 2016 statement by the American Statistical Association on what p-values can and can’t tell us is another step in the right direction, while the decision by the journal Basic And Applied Social Psychology to ban p-values from its articles outright should also serve as a wake-up call.
We shouldn’t forget, too, that the hardest person to convince must always be ourselves. The person best equipped to evaluate data is the one who did the experiment. Once we’ve convinced ourselves, we can then see about convincing others.
*If you don’t understand a figure, don’t blame yourself. It doesn’t make you stupid – it means it’s a bad figure.
Originally posted on Total Internal Reflection - here.


Join the FEBS Network today
Joining the FEBS Network’s molecular life sciences community enables you to access special content on the site, present your profile, 'follow' contributors, 'comment' on and 'like' content, post your own content, and set up a tailored email digest for updates.